 Sezer
It has been a week since NASA Space Apps Challenge 2026 wrapped up. Now that the sleep debt is gone and the post-hackathon adrenaline has settled, I wanted to write down what we built, why the problem hooked us so hard, and a few engineering decisions I am still smiling about.
My teammate Kerem (who owned the physics, terrain pipeline, and backend) and I (frontend and web app) built Lunaris, an interactive tool for comparing landing sites near the lunar south pole.
A one-week delay can kill a mission
Near the Moon’s equator, the Sun climbs high overhead just like you would expect. Near the south pole, it never rises more than a few degrees above the horizon. It just circles the skyline, skimming crater rims and distant ridges.
That changes everything. A hill a few kilometers away can throw a lander into darkness for days. Move your landing date by a week, or shift your touchdown spot by a few hundred meters, and you can go from a comfortable mission to a dead battery.
Here is a real example from our app: a 14-day mission landing on Mons Mouton on December 16, 2026 gets 100% usable sunlight and a risk score of 0. Push the launch back by seven days? Usable sunlight drops to 51%, you hit 6.6 days of continuous darkness, and the risk shoots to 100. Wait 28 days for the next lunar cycle, and you are right back to risk 0.
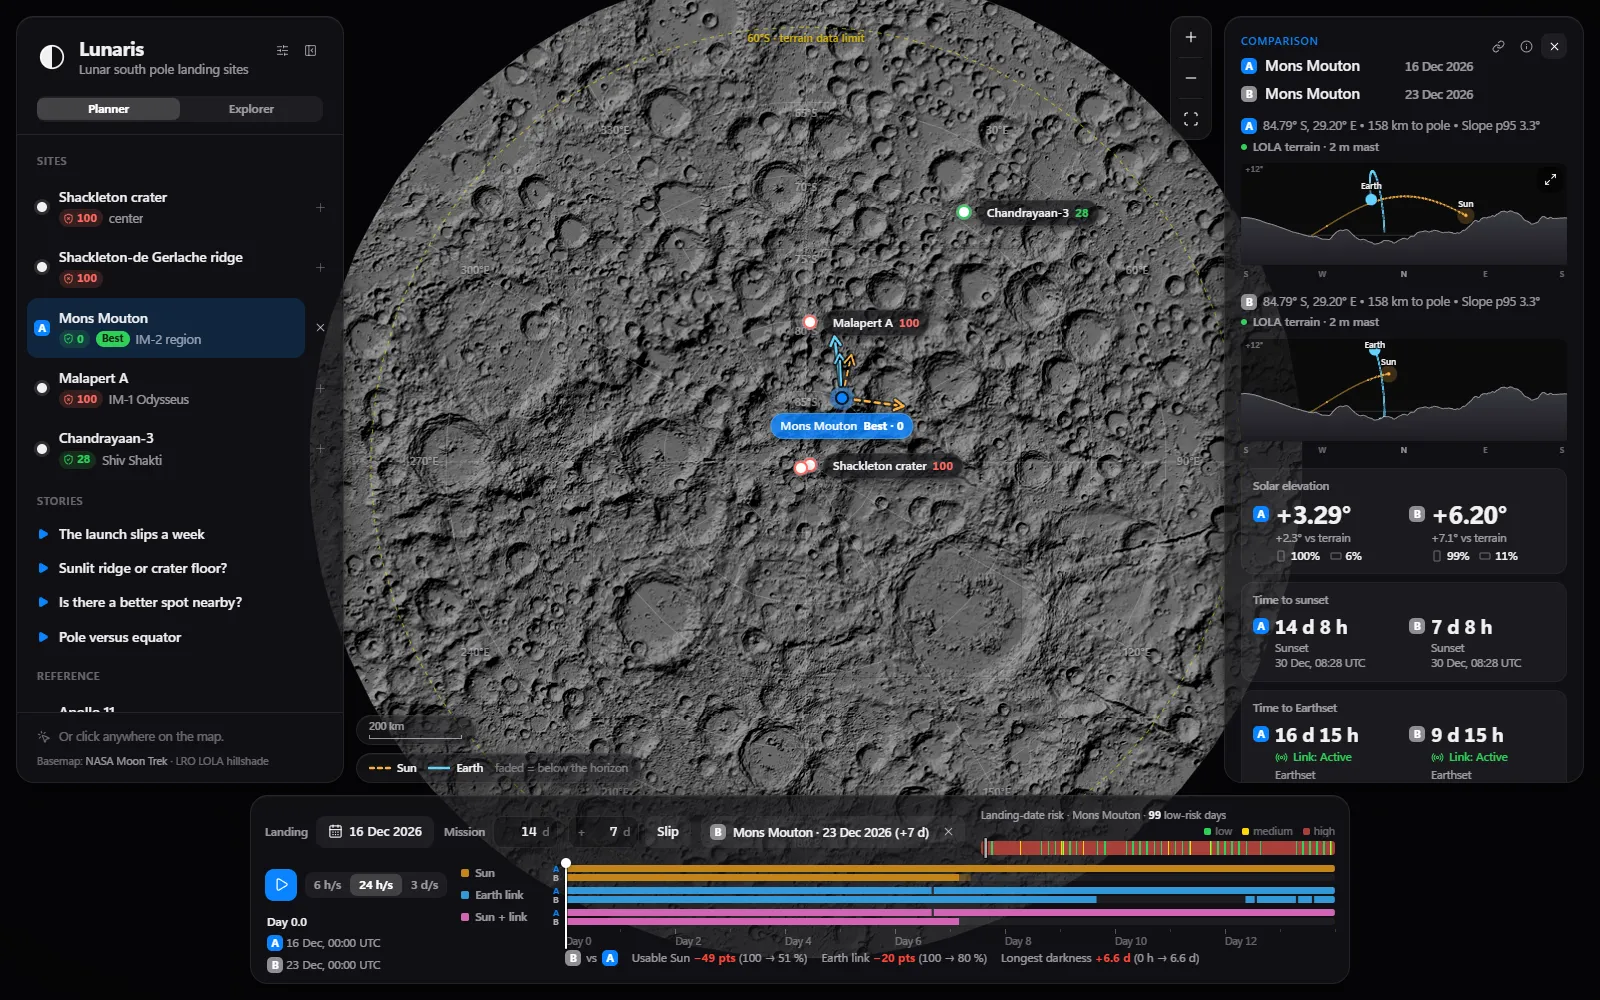
Tools like JPL Horizons, Moon Trek, and QuickMap already hold the underlying NASA data. They are incredible, but answering a simple “our launch slipped a week, now what?” meant juggling multiple expert interfaces and raw tables. We wanted that answer in one click.
Designing for two very different people
Early on, we noticed a tension: if we only built a dashboard full of elevation graphs and slope percentiles, only space nerds would enjoy it. If we only built a pretty 3D toy, it wouldn’t answer real planning questions.
So we split Lunaris into two modes backed by the exact same model:
- Planner: Side-by-side scenario comparison, a date-slip slider, a transparent 0-100 risk breakdown (power, direct-to-Earth communication, and slope), and an 81-point grid scan around your landing spot to find a safer patch within 500 meters. Every scenario lives in the URL, so you can share a link to an exact comparison.
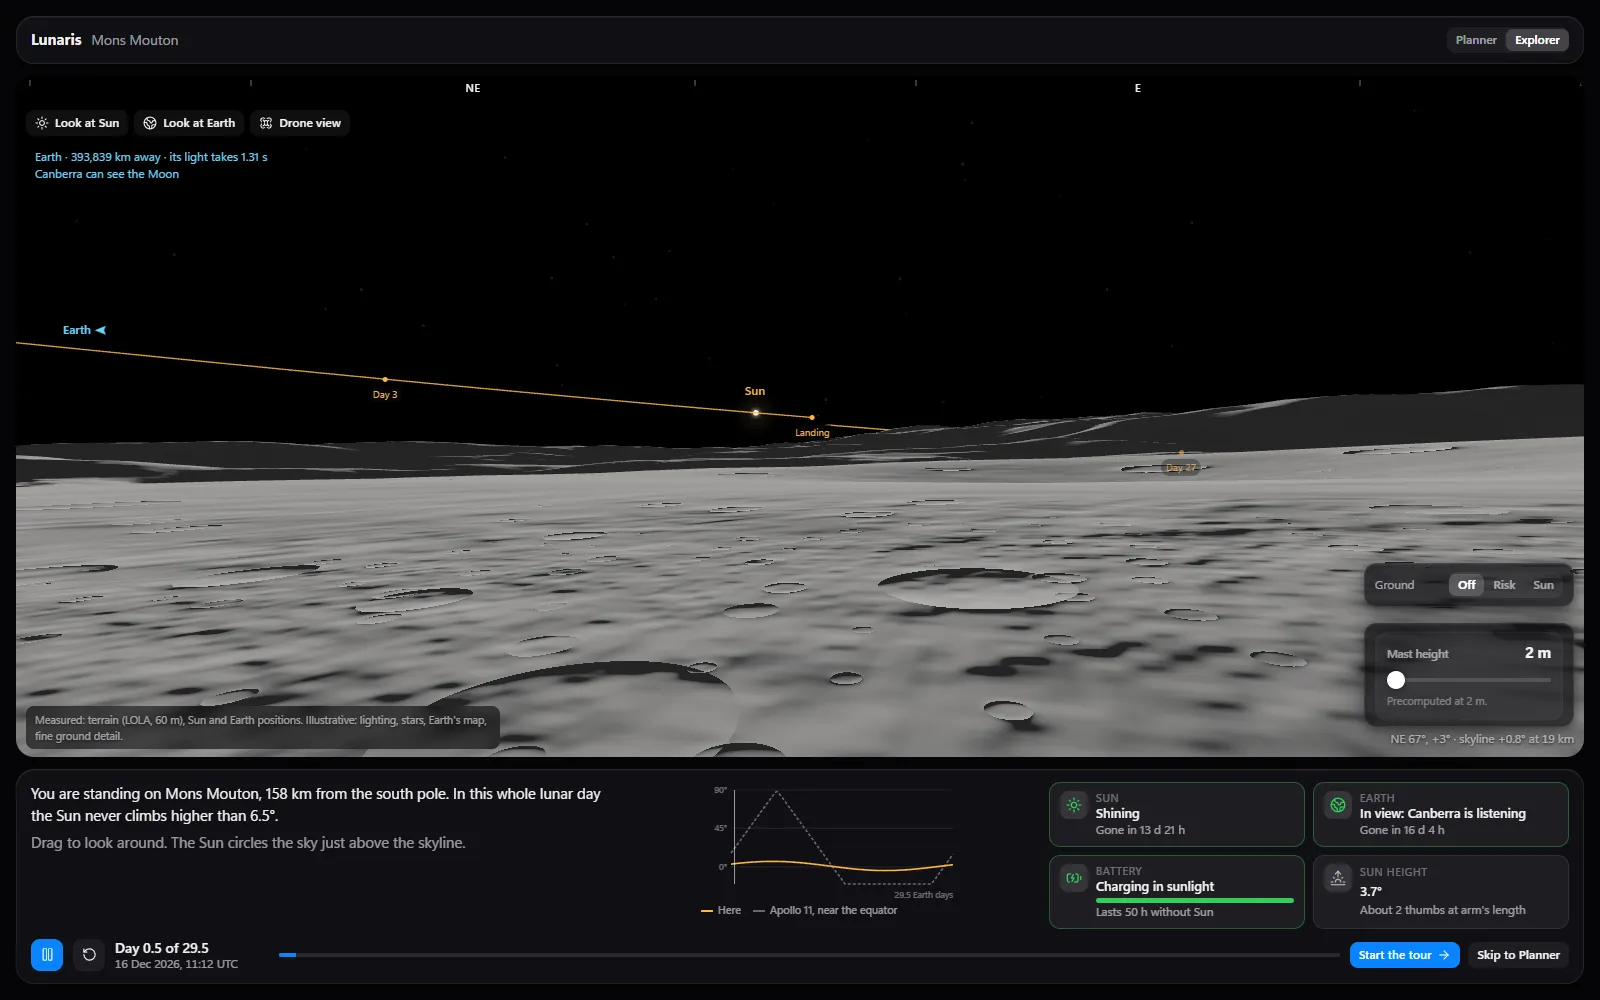
- Explorer: A short guided tour, a pole vs equator comparison against Apollo 11, and a small landing game where you get three scout flights to pick a spot that won’t freeze or tip over.
Moving the Moon into the browser
One of my favorite architectural choices was keeping the app snappy without hammering a server every time a user drags a date slider or tweaks battery life.
Instead of precomputing separate sky tables for every site, Kerem generated a single hourly ephemeris table from JPL’s DE421 kernels via Skyfield, storing the Sun and Earth vectors relative to the Moon’s center. From that one file, the browser projects the vectors onto any coordinate’s local east/north/up axes on the fly:
const up = [
Math.cos(lat) * Math.cos(lon),
Math.cos(lat) * Math.sin(lon),
Math.sin(lat),
]
const east = [-Math.sin(lon), Math.cos(lon), 0]
const north = [
-Math.sin(lat) * Math.cos(lon),
-Math.sin(lat) * Math.sin(lon),
Math.cos(lat),
]
for (let i = 0; i < count; i++) {
const x = xs[first + i] - radius * up[0]
const y = ys[first + i] - radius * up[1]
const z = zs[first + i] - radius * up[2]
const e = east[0] * x + east[1] * y + east[2] * z
const n = north[0] * x + north[1] * y + north[2] * z
const u = up[0] * x + up[1] * y + up[2] * z
az[i] = (((Math.atan2(e, n) / DEG) % 360) + 360) % 360
alt[i] = Math.atan2(u, Math.hypot(e, n)) / DEG
}We also ported the entire Python risk engine to TypeScript and added a validation script (npm run validate) that checks browser outputs against the Python reference across every curated site and all 352 landing dates of the year. If a refactor ever causes the frontend and backend to disagree by even an hour, the test catches it.
One endpoint, infinite cache
For the curated landing sites, horizons are precomputed. But we also wanted users to click anywhere south of 60°S and get a real terrain horizon, not a smooth sphere approximation.
The catch: NASA’s LOLA 60 m elevation map (LDEM_60S_60MPP_ADJ.TIF) is 2.9 GB. Instead of shipping or downloading the whole file on every request, our small FastAPI service on Cloud Run reads only the byte ranges it needs over HTTP range requests.
And my favorite single line in the backend:
CACHE_HEADER = "public, max-age=31536000, immutable"You don’t often get to mark a geospatial API response as genuinely immutable. On the Moon, a mountain isn’t going anywhere.
Rendering 250 km of terrain in Three.js
Numbers tell you that a site loses power; standing on the surface shows you why. The 3D surface view drops you onto real LOLA topography with GPU shadows and draws the Sun’s and Earth’s paths across the sky: solid when visible, dashed when hidden behind a ridge.
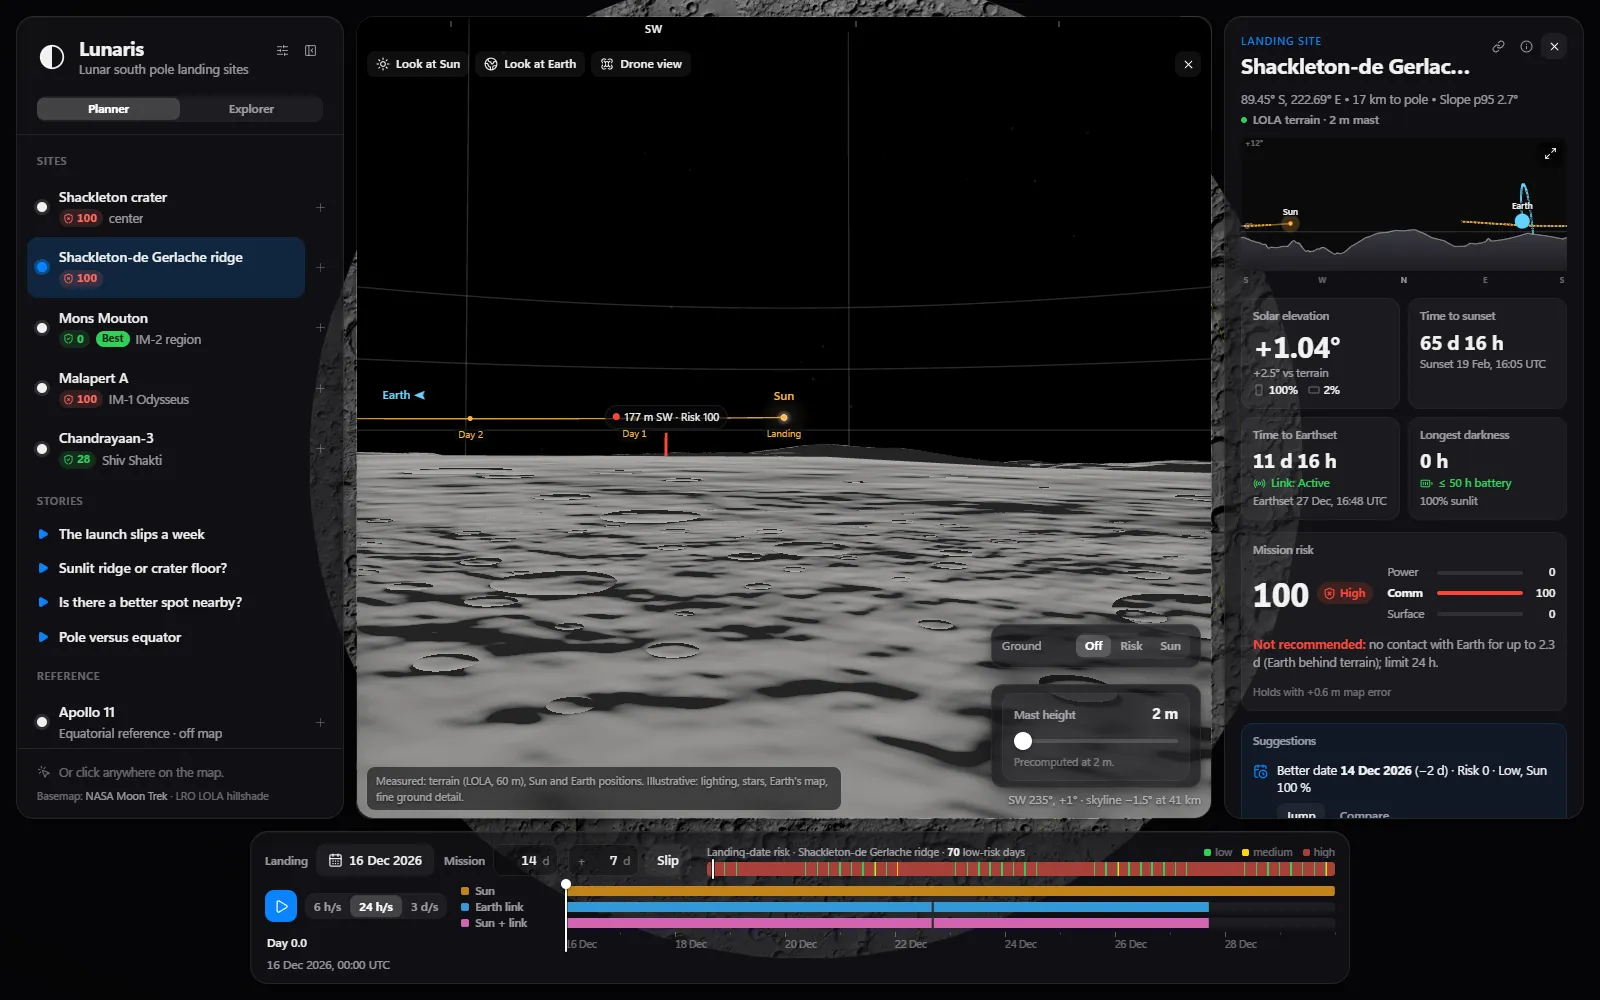
Three practical problems came up quickly while building it:
- Depth buffer precision across huge distances: You need sharp ground detail 60 meters from your feet and a skyline ridge 250 kilometers away. One giant near/far frustum turns distant terrain into a flickering mess. Instead, we render four nested terrain levels (from 3.8 km pixels down to 60 m) outermost-to-innermost, clearing the depth buffer between layers with tight near/far planes for each.
- Never disagreeing with the numbers: Shadow maps are great for visuals, but slight grazing-angle artifacts near the camera could make the ground look dark while the metric card says “Sun visible.” So within 60-150 meters of the observer, the shader blends directly into the risk engine’s exact solar-disk visibility. The view and the numbers never contradict each other.
- Surviving integrated GPUs: Real-time shadows while scrubbing through 14 days of playback can choke a laptop GPU. We added a tiny four-step adaptive quality loop that scales down resolution and shadow-recompute frequency if frames drop below ~40 FPS, then redraws a full-resolution frame 350 ms after you stop moving so every still view is crisp.
Sanity-checking against a real mission
During a hackathon it is dangerously easy to build something that looks scientific while silently outputting nonsense. So we validated the core numbers hard:
- JPL Horizons: Hourly Sun and Earth positions matched within
0.00002°. - Chandrayaan-3 backtest: We fed our model the real landing coordinates and date of ISRO’s Chandrayaan-3 mission (August 23, 2023). Lunaris scored that date risk 0 right inside its low-risk window, and the model’s predicted sunset (September 4, 2023 at 07:17 UTC) matched the exact day ISRO put the lander to sleep.
Seeing that backtest line up was easily the best moment of the whole weekend.
Try it out
If you want to poke around Mons Mouton, stand inside the permanently shadowed floor of Shackleton crater, or try not to strand a rover in the landing game:
- Live app: lunaris.sezergumus.dev
- Source code (MIT): github.com/Sezergumus/lunaris
If you break anything, or find a surprisingly sunny spot near the pole, let me know.